
TTD Research

Research you can actually trade by.

Each report answers one question with real market data — and what it means for an options seller. Read the key findings here; the full report is free by email.

TTD Research · No. 01

Every year has a dip

45 years of S&P 500 intra-year pullbacks (1981–2025): how deep the normal fall is, how often it happens, and what it means if you sell options for income.

  • The median year’s largest fall from a high was 10.3%
  • 24 of 45 years saw a drop of 10% or more — yet 34 of 45 still finished higher
  • Only 2 years in 45 got through without a 5% dip

Free. We'll email you the PDF (new here? confirm your email first). Educational research only — not financial advice. E&OE. See our Terms, Risk disclaimer and privacy notice.
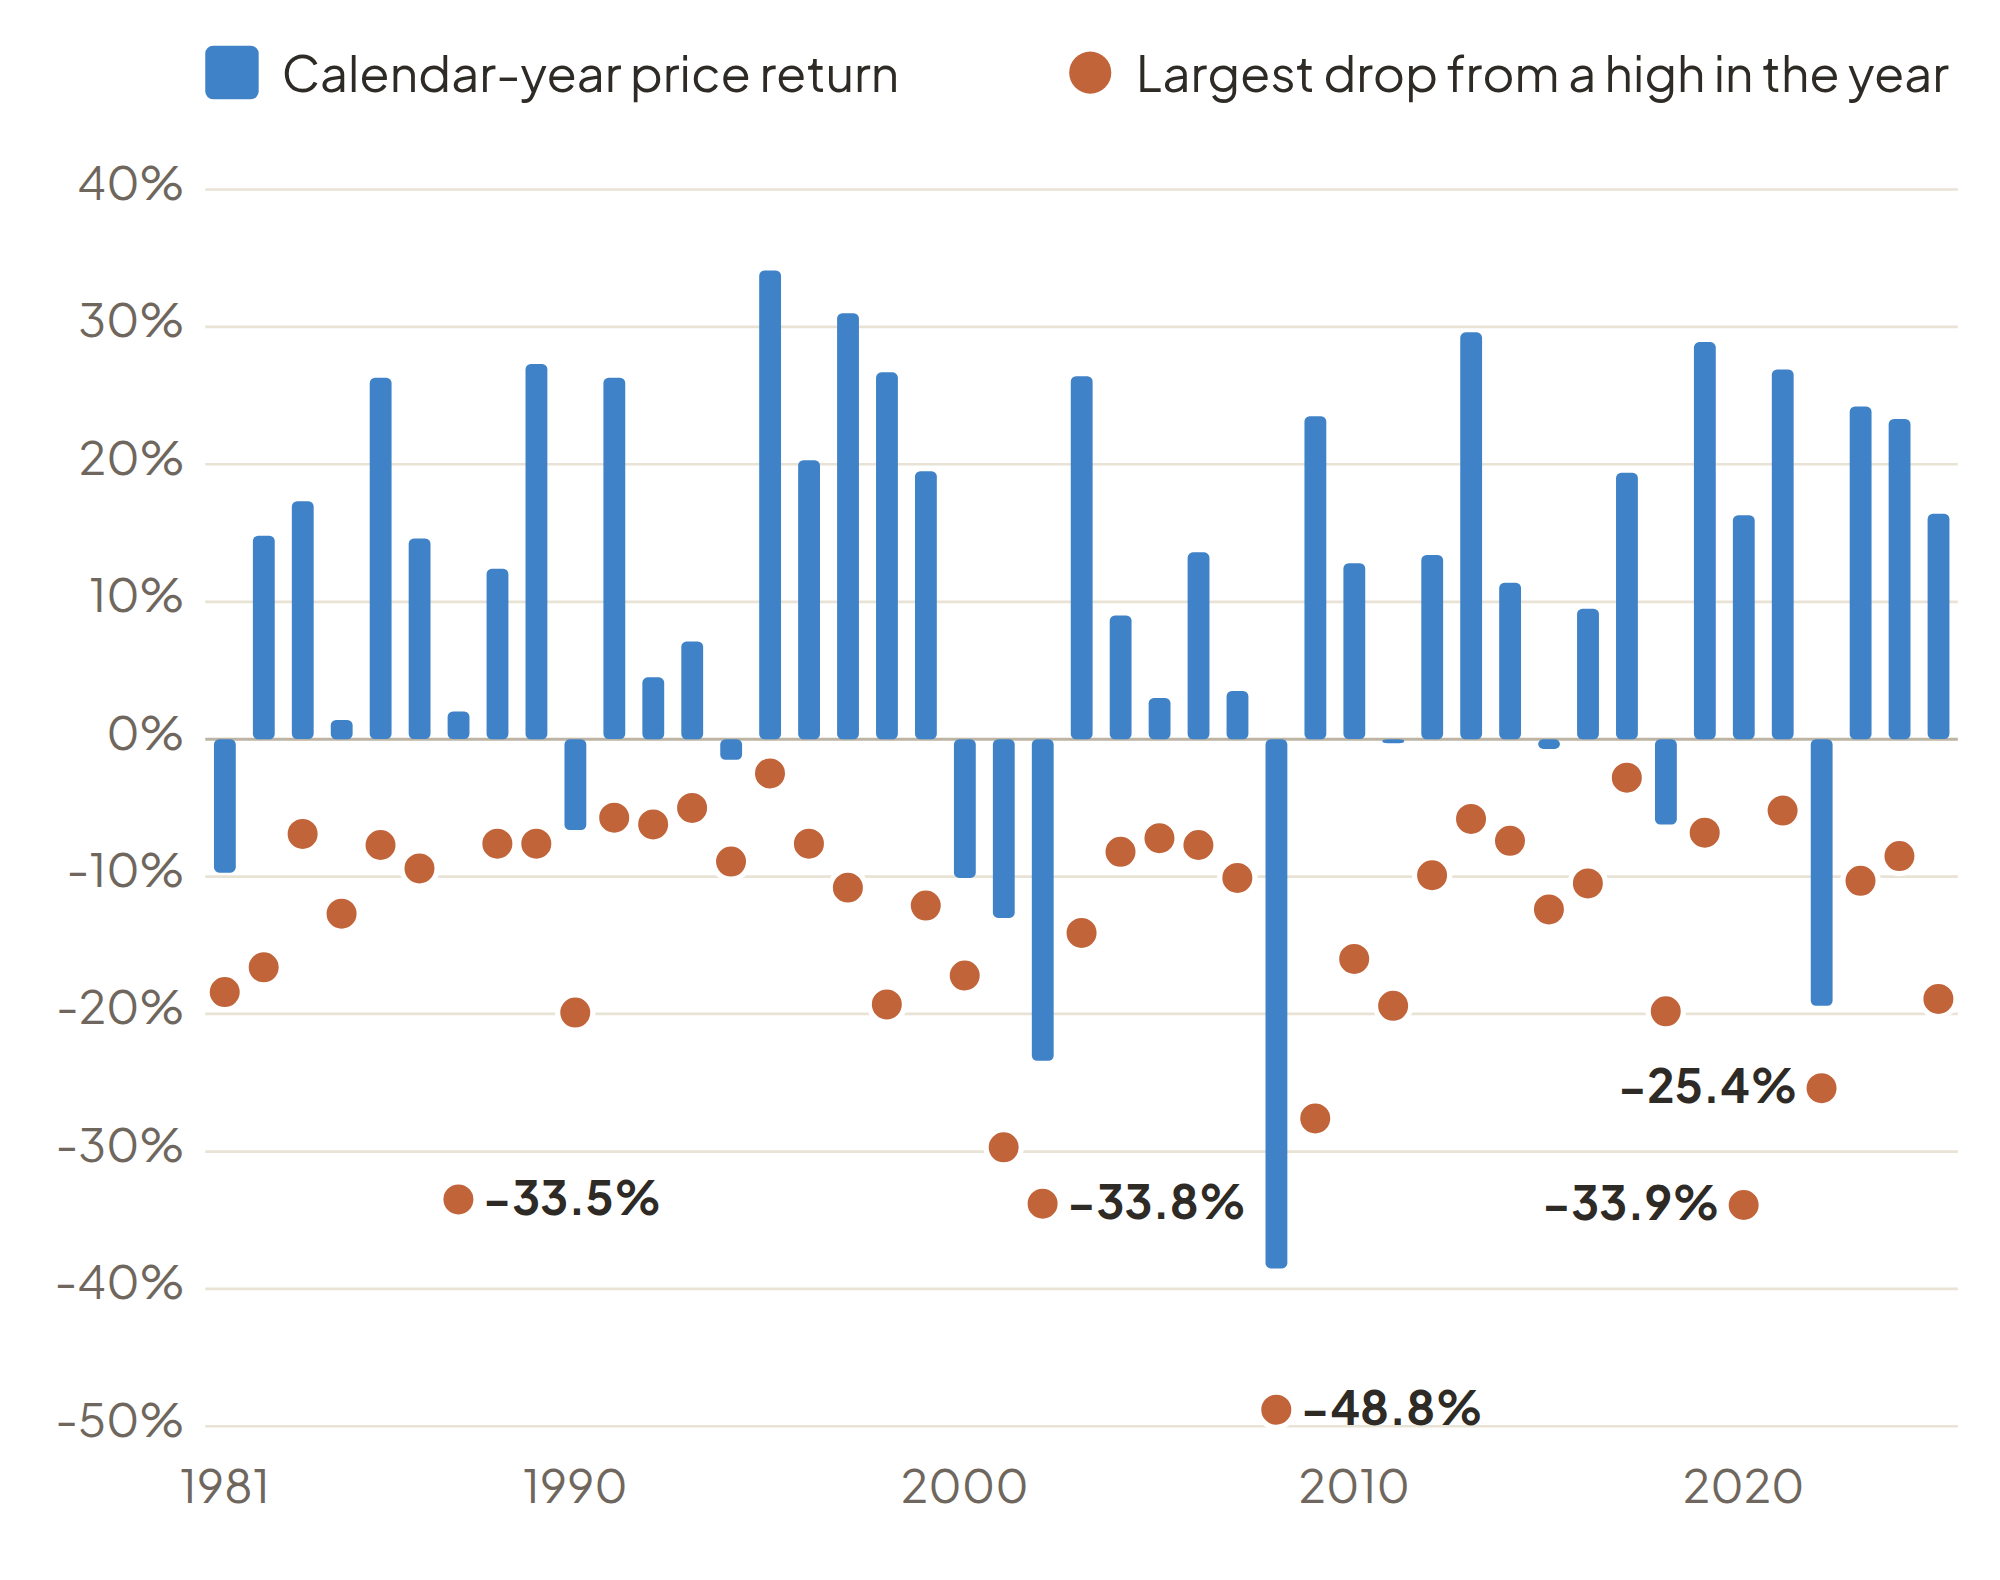
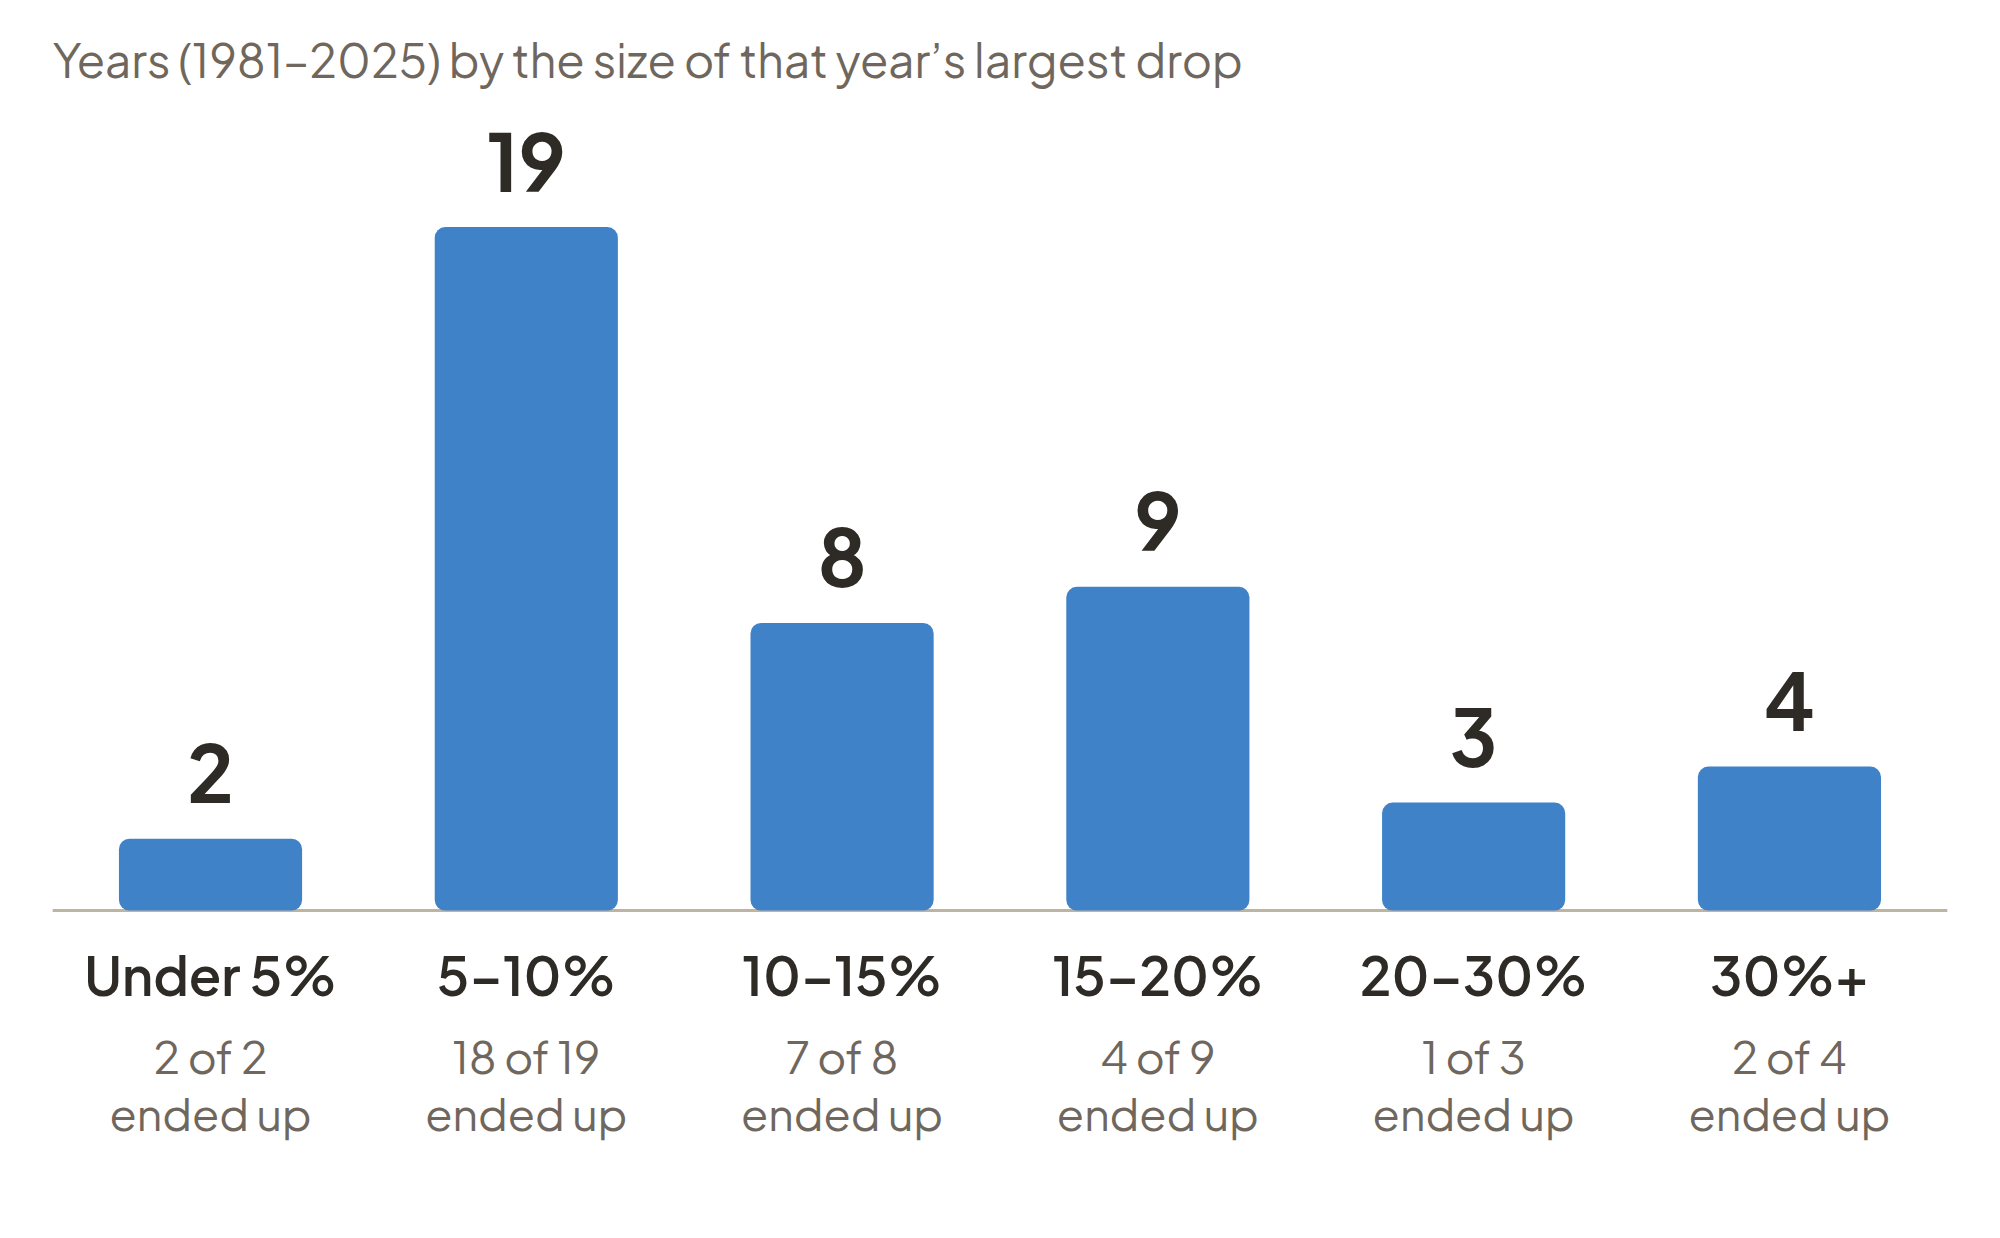
Chart: S&P 500 calendar-year return and largest intra-year drop, 1981–2025
Bar chart: number of years by the size of the largest intra-year S&P 500 drop, 1981–2025
Weekly, free

Get my weekly market notes on Telegram.

Short, rules-first commentary — no spam, no signals.

Join the free Telegram channel

Education only — not financial advice. Options involve risk and can lose money. Past market behaviour doesn't predict future results. E&OE — errors and omissions excepted. See our Terms and Risk disclaimer.